
observability-mcp
The unified observability gateway for AI agents.
One MCP server that connects to any observability backend through pluggable connectors,normalizes the data, adds intelligent analysis, and provides a web UI for configuration.
What Grafana did for dashboards, we do for AI agents.
![]()
![]()
![]()


Try it in 10 seconds
npx @thotischner/observability-mcp
# then open http://localhost:3000
The server starts with zero sources. Add Prometheus/Loki via the Web UI or PROMETHEUS_URL / LOKI_URL env vars.
Want the full chaos-engineering demo (Prometheus + Loki + 3 example services + the autonomous agent)? Clone and run:
make demo # equivalent to: docker compose --profile demo up --build --wait
See make help for all canonical workflows.
Why?
Every observability vendor ships its own MCP server — Prometheus, Grafana, Datadog, Elastic, each siloed. AI agents that need to reason across systems must juggle N separate servers. There is no unified abstraction layer.
observability-mcp is that layer.
Features
- Unified gateway — Single MCP endpoint for all your observability backends.
- Cross-signal analysis — Correlates metrics and logs automatically (z-score anomalies, weighted health scoring).
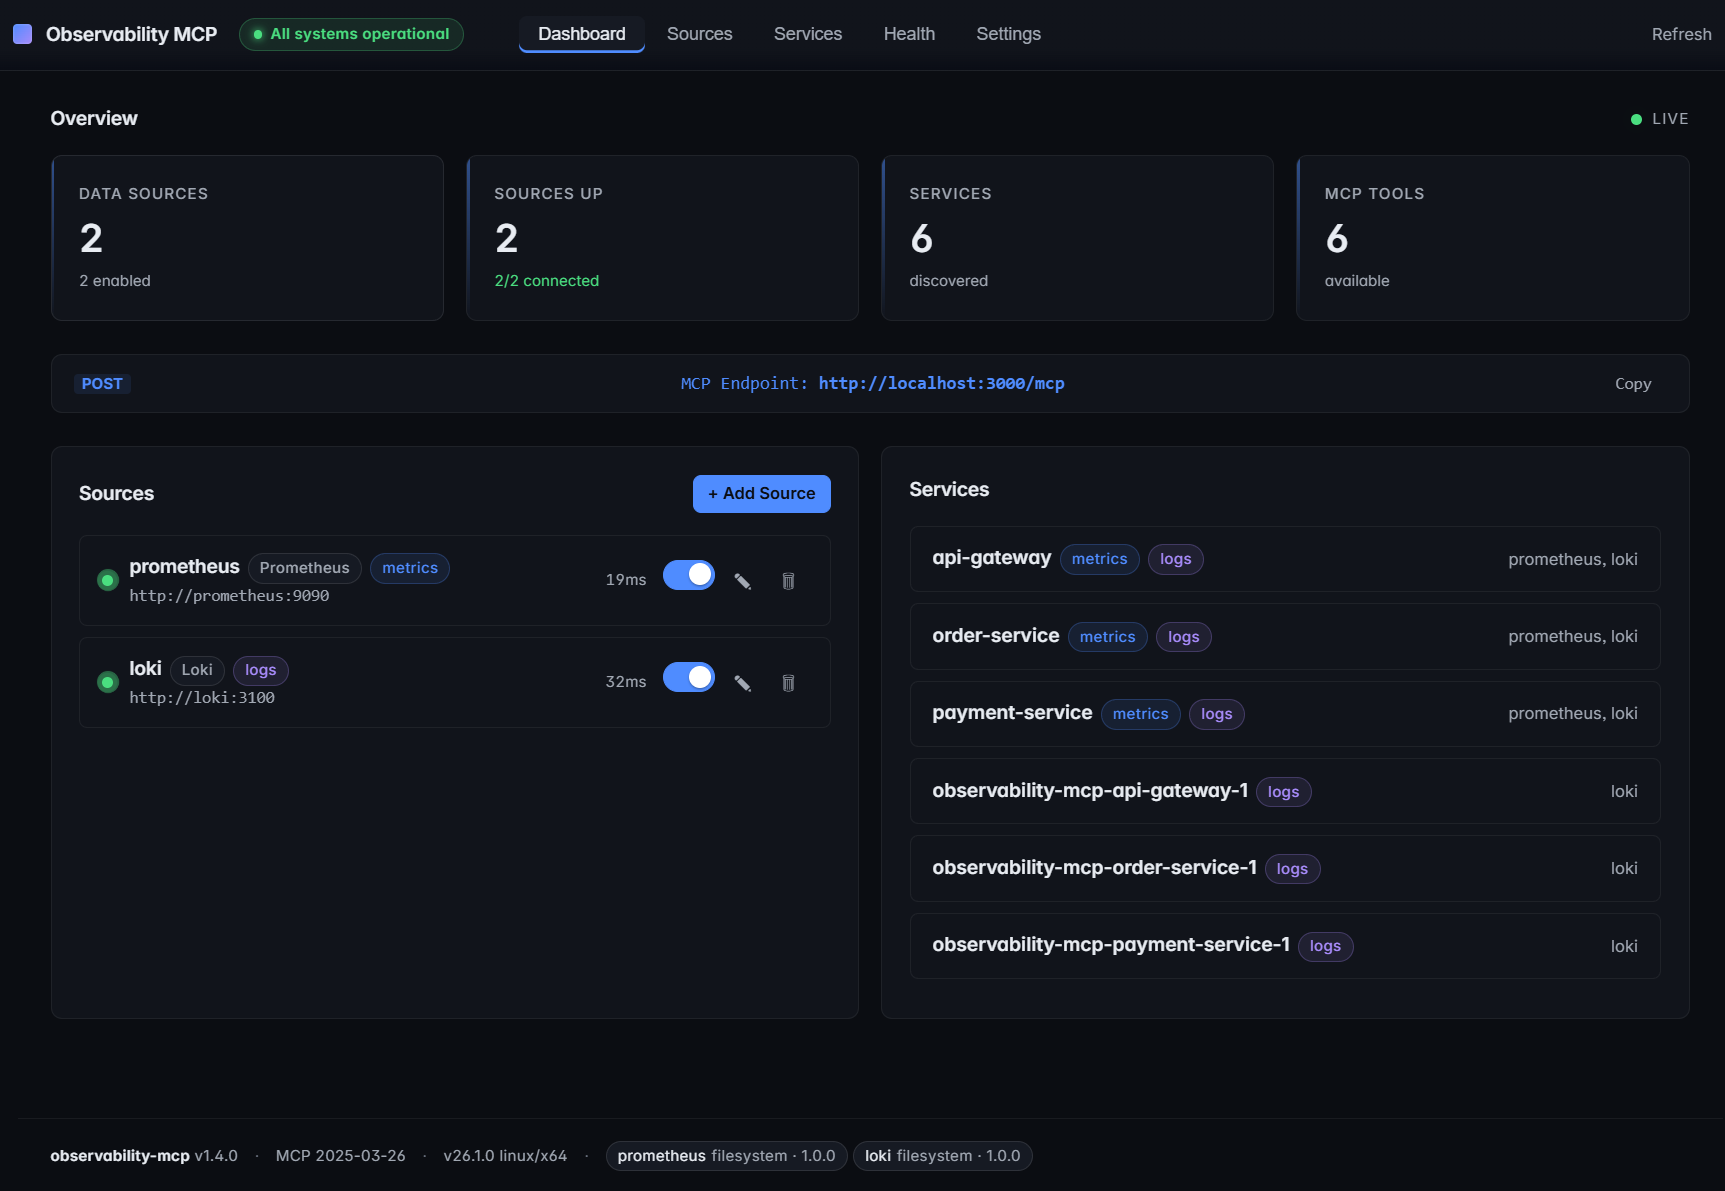
- Web UI — Sources, services, health monitoring, configuration. Real-time, dark theme.
- prom-client defaults — Works out of the box with the standard Node.js Prometheus instrumentation. Dynamic label resolution probes
job/service/app/service_nameso service filtering Just Works. - Loki label fallback — Discovers services through
service_name/service/job/app/container, including Docker-shipped streams with leading slashes. - Pluggable connectors — One interface, any query language (PromQL, LogQL, Flux, KQL...). See docs/connectors.md.
- Auth & TLS — Basic, Bearer, custom CA, mTLS. See docs/auth-and-tls.md.
- Multi-backend — Multiple instances of the same type, no problem.
Architecture
graph TB
    Agent["AI Agent<br/><small>Claude, Ollama, etc.</small>"]

    subgraph MCP ["observability-mcp :3000"]
        Tools["6 MCP Tools"]
        Analysis["Analysis Engine<br/><small>Z-score, Health Scoring, Correlation</small>"]
        UI["Web UI"]
    end

    subgraph Connectors ["Pluggable Connectors"]
        Prom["Prometheus<br/><small>PromQL</small>"]
        Loki["Loki<br/><small>LogQL</small>"]
        Next["Your Backend<br/><small>Any query language</small>"]
    end

    Agent <-->|"MCP<br/>Streamable HTTP"| Tools
    Tools --- Analysis
    Tools --- UI
    MCP --> Prom & Loki & Next

    style MCP fill:#1a1a2e,stroke:#58a6ff,color:#fff
    style Connectors fill:#0d1117,stroke:#3fb950,color:#fff
    style Agent fill:#58a6ff,stroke:#58a6ff,color:#000
    style Next fill:#0d1117,stroke:#3fb950,color:#8b949e,stroke-dasharray: 5 5
Repo layout
mcp-server/   # the product — server, Web UI, analysis engine, built-in plugins
helm/         # ArtifactHub-grade Helm chart
docs/         # configuration, auth, plugin architecture, airgapped deployment, ...
examples/     # demo material — agent, example services, Prometheus+Loki configs
mcp-server/ is what you install. Everything under examples/ is opt-in via docker compose --profile demo — it's how the repo demos chaos detection end-to-end, but production deployments don't need any of it.
Installation
| Method | Command | Best for |
|---|---|---|
| npm | npx @thotischner/observability-mcp |
Local dev, Node toolchains, zero install |
| Docker (GHCR) | docker run -p 3000:3000 ghcr.io/thotischner/observability-mcp:latest |
Production hosts, isolation |
| Helm | helm repo add observability-mcp https://thotischner.github.io/observability-mcp/helm install observability-mcp observability-mcp/observability-mcp |
Kubernetes |
| From source | git clone … && make demo |
Full POC with example services and chaos |
GHCR is multi-arch (amd64 + arm64). Available tags: latest, main, X.Y.Z, X.Y, X, sha-<commit>. Note: the leading v is stripped from semver tags.
Helm chart
The chart ships with Deployment, Service, optional Ingress/PVC/HPA, NetworkPolicy, ServiceMonitor (auto-gated on the Prometheus Operator CRD), helm test connection probe, and values.schema.json validation. ArtifactHub-grade annotations. See helm/observability-mcp/ for the full values reference, or the airgapped deployment guide for a hardened production example.
helm repo add observability-mcp https://thotischner.github.io/observability-mcp/
helm repo update
helm install observability-mcp observability-mcp/observability-mcp \
  --set sources.prometheusUrl=http://prometheus.monitoring.svc.cluster.local:9090 \
  --set sources.lokiUrl=http://loki.logging.svc.cluster.local:3100
# docker-compose snippet
services:
  observability-mcp:
    image: ghcr.io/thotischner/observability-mcp:latest
    ports: ["3000:3000"]
    environment:
      PROMETHEUS_URL: http://prometheus:9090
      LOKI_URL: http://loki:3100
    volumes:
      - ./mcp-config:/home/node/.observability-mcp
    restart: unless-stopped
For full configuration — paths, env vars, ${VAR} substitution, complete sources.yaml reference — see docs/configuration.md.
Quick Start
Option A: Standalone (your own backends)
npx @thotischner/observability-mcp
Then open the Web UI at http://localhost:3000, click Sources → + Add Source, point at your Prometheus/Loki URLs. Or skip the UI:
PROMETHEUS_URL=http://localhost:9090 LOKI_URL=http://localhost:3100 \
  npx @thotischner/observability-mcp
Option B: Grafana Cloud
Grafana Cloud uses Basic Auth with your numeric instance ID as username and an API token as password. The instance ID for Prometheus and Loki is different — find both in Connections → Data sources.
# ~/.observability-mcp/sources.yaml
sources:
  - name: grafana-cloud-prom
    type: prometheus
    url: https://prometheus-prod-XX-prod-eu-west-X.grafana.net/api/prom
    enabled: true
    auth:
      type: basic
      username: "${GRAFANA_PROM_USER}"   # numeric instance ID
      password: "${GRAFANA_TOKEN}"
  - name: grafana-cloud-loki
    type: loki
    url: https://logs-prod-XXX.grafana.net
    enabled: true
    auth:
      type: basic
      username: "${GRAFANA_LOKI_USER}"   # different from Prom!
      password: "${GRAFANA_TOKEN}"
GRAFANA_PROM_USER=… GRAFANA_LOKI_USER=… GRAFANA_TOKEN=glc_… \
  npx @thotischner/observability-mcp
Option C: Full demo (Docker Compose with example services)
git clone https://github.com/ThoTischner/observability-mcp.git
cd observability-mcp
docker compose --profile demo up --build
Boots 8 containers with health checks: 3 example microservices, Prometheus, Loki, Promtail, the MCP server, and the agent. Open http://localhost:3000.
Without --profile demo, only mcp-server starts — useful when you already run Prometheus/Loki elsewhere and just want to expose them via MCP.
MCP Tools
| Tool | Signal | Purpose |
|---|---|---|
list_sources |
meta | Discover configured backends and connection status |
list_services |
meta | Discover monitored services across all backends |
query_metrics |
metrics | Query metrics with pre-computed summary stats |
query_logs |
logs | Query logs with error/warning counts and top patterns |
get_service_health |
unified | Health score combining metrics + logs (0–100) |
detect_anomalies |
unified | Cross-signal anomaly detection with z-score analysis |
Using with Claude Code
Connect Claude Code directly — no agent needed.
CLI:
claude mcp add observability --transport http http://localhost:3000/mcp
Or .mcp.json in your project root (commit-friendly):
{
  "mcpServers": {
    "observability": {
      "transport": { "type": "http", "url": "http://localhost:3000/mcp" }
    }
  }
}
Then ask Claude in natural language. For example, after triggering chaos in the demo (curl -X POST http://localhost:8081/chaos/error-spike):
"Are there any anomalies right now?"
Claude calls detect_anomalies and finds:
{
  "anomalies": [
    { "metric": "cpu", "severity": "high", "service": "payment-service",
      "description": "cpu is 3.4σ above baseline (18.36 → 37.31)" },
    { "metric": "request_rate", "severity": "low", "service": "payment-service",
      "description": "request_rate is -1.8σ below baseline (0.08 → 0.04)" }
  ]
}
"Show me the error logs for payment-service."
Claude calls query_logs:
{
  "summary": {
    "total": 11, "errorCount": 11,
    "topPatterns": [
      "Request failed: internal error during POST /payments (6x)",
      "Request failed: internal error during POST /refunds (4x)"
    ]
  }
}
Claude correlates the signals — CPU spike, error logs flooding, request rate halved — and explains the incident in plain language. No PromQL, no LogQL.
Demo: Chaos Engineering
Three example microservices generate traffic and support chaos injection:
curl -X POST http://localhost:8081/chaos/high-cpu        # CPU spike
curl -X POST http://localhost:8081/chaos/error-spike     # CPU + latency + errors
curl -X POST http://localhost:8081/chaos/slow-responses  # Latency
curl -X POST http://localhost:8081/chaos/memory-leak     # OOM logs
curl -X POST http://localhost:8081/chaos/reset
The agent (docs/agent.md) detects anomalies within 30 seconds and produces an LLM incident analysis if Ollama is running.
CLI (omcp)
A Confluent-style control CLI ships in the same npm package (omcp bin):
omcp doctor                       # check docker / compose / helm / node
omcp demo up                      # full demo stack (auto-picks free host ports)
omcp plugin list                  # browse the connector hub catalog
omcp plugin install [email protected] --trust-root key.pem    # download + verify + extract
omcp plugin verify ./plugins/tempo --trust-root key.pem # offline audit
omcp helm upgrade obs -- -n monitoring --set sources.prometheusUrl=http://prom:9090
Plugin install/verify reuse the server's fail-closed signature + integritychecks (offline-capable; --offline-dir for airgapped). Extra helmflags pass through after a literal --.
Docs
- Configuration — paths, env vars,
${VAR}substitution, fullsources.yamlreference - Authentication & TLS — Basic, Bearer, custom CA, mTLS
- Prometheus — defaults, label resolution,
resolvedSeries, prom-client compatibility - Loki — label fallback, Docker container slash, managed Loki
- Connectors — write your own backend
- Agent — Ollama setup, loop behavior
- Troubleshooting — common pitfalls and fixes
- Security — automation pipeline, vulnerability reporting, built-in protections
- Airgapped deployment — mirroring images, private plugins, GitOps-friendly config
- Connector Hub — browse versioned, signed connectors (catalog:
hub/) - Use cases — five scenarios with the prompts that drive them
Endpoints
| Service | URL |
|---|---|
| MCP Server (Streamable HTTP) | http://localhost:3000/mcp |
| Web UI | http://localhost:3000 |
| Health API | http://localhost:3000/api/health |
In the docker-compose demo: Prometheus on :9090, Loki on :3100, services on :8080–:8082.
Tech Stack
TypeScript + Node 20, @modelcontextprotocol/sdk (Streamable HTTP), Express, Zod, js-yaml, prom-client (example services), Prometheus, Loki, Promtail, Docker Compose, optional Ollama.
Requirements
- Standalone: Node 20+ (or just
npx) - Docker demo: Docker + Compose, 4 GB+ RAM (8 GB+ with Ollama)
- Optional: Ollama on the host for the agent's LLM analysis
Contributing
- Fork the repo and
docker-compose up --build. - Pick an issue or open one to discuss your idea.
- Submit a PR — all code runs in Docker, no local deps.
Ideas: new connectors (InfluxDB, Elasticsearch, Datadog), additional analysis algorithms, UI improvements.
License
MIT
If you find this useful, consider giving it a star — it helps others discover the project.